The Online Labour Index is an index measuring the changes in the volume of projects transacted in major online platforms. As a part of OLI, we also report a breakdown across different occupations. In this post I will discuss how the occupation classification used in the OLI is constructed.
In order to classify the work done on the various platforms, the disparate classifications utilised across platforms need to be normalised. For the platforms that provide a taxonomy, we manually map the occupation taxonomies to 6 broadly similar occupation classes outlined below. The 6 classes are adopted from the existing classifications used in in major online freelancing platforms, and by all accounts capture the main contours of online work relatively well.
| Occupation class name | Examples of work |
|---|---|
| Clerical and data entry | customer service, data entry, transcription |
| Creative and multimedia | animation, graphic design, photography |
| Professional services | accounting, legal, project mgmt |
| Sales and marketing support | lead generation, posting ads, search engine optimisation |
| Software dev and tech | data science, game dev, movile dev, qa |
| Writing and translation | article writing, copywriting, translation |
The typical microwork or human intelligence work vacancies which include tasks like data entry, image classification fall in the Clerical and data entry category. These tasks typically require only basic computer literacy and numeracy. The occupations in the professional services category, on the other hand, typically require formal education and knowledge about local institutions. The Sales and marketing support are largely support tasks related to online advertising. They are separated from the two other aforementioned categories because they form a large and distinct portion of online freelancing. Writing, software development, and creative categories are mostly self-explanatory.
The mapping has an obvious caveat. Namely, there are some occupations whose class is not clear. For example, take a web site design vacancy which includes both graphical design and programming of the web site. In this case, the vacancy could either be either classified as a design and creative vacancy, or as a programming vacancy. This caveat is not specific to our occupation classification, but is present in all empirical studies studying occupational groups. Nonetheless, we believe that in the case of the OLI this problem is smaller because in the case of typical labour force surveys the classification of occupations is done retrospectively after a vacancy is posted on a job board, but in our case it is in the interest of the employer posting a job ad to classify it in a correct fashion to get the best matching pool of applicants to their vacancy.
Employing machine learning to predict unobserved occupation classes
The platforms do not expose their occupation taxonomies for some 15% of the vacancies. In order to classify these vacancies, we employ a machine learning process, which is discussed next.
We took a random sample of about 1172 vacancies from the set of vacancies with an unobserved occupation class. The 1172 sampled job vacancies were manually classified to 6 occupations. We used the 1172 manually classified projects as the training data set for our classifier. We first processed the projects’ titles and descriptions by removing stopwords, and stemming the other observed words. As a result, we ended up with a 1172 * 2951 matrix where each row represents a project, and every column represents the word count of different stemmed words, which are the predictive features in our model.
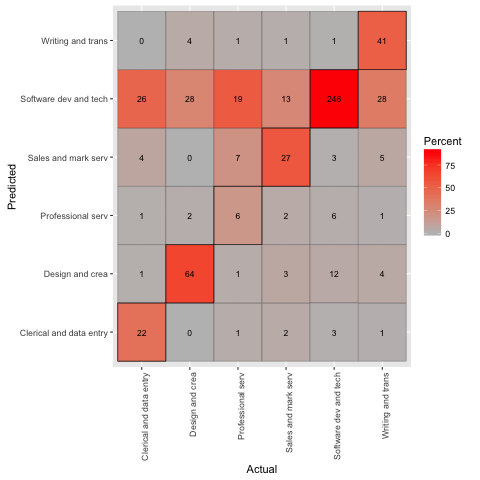
We used a regularised multinomial logistic classifier implemented in R‘s glmnet package. We evaluated our prediction by randomly splitting our training sample in two, and fitted a model with half of the data, predicted the occupation classes for the other half, and compared our predictions to the observed occupation classes. The confusion matrix from this exercise is presented below.
The shares of correctly predicted classes — i.e. the precision of the classifier — are visible from the diagonal of the confusion matrix. Dividing the sum of diagonal elements (418) by the total number of projects in our validation dataset (586) demonstrates that our classifier achieves a reasonable accuracy of 72%.
By far, our accuracy is the highest in the software development and technology occupation. This is to some extend driven by the fact that our training data is unbalanced; over 50% of the projects are in the software development and technology category, whereas only roughly 5% of the projects are in the professional services category.
Conclusions
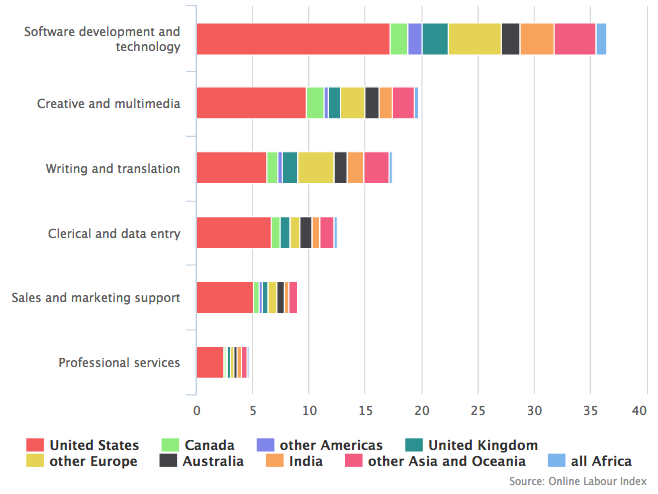
As a result of the classification process discussed in this blog post, we are able to present the occupation distribution of the projects across countries. This data can be used to derive various insights.
This post is a second post in a series of blog posts which discuss the methodology of the construction of the OLI. For details of how the OLI is constructed, see previous post.

