Employers and workers are increasingly using online platforms to engage in project- or task-based freelance work delivered over the Internet. This is known as the online gig economy, and it can be seen as part of both the “sharing economy” and the wider gig economy of temporary work. But do we know that it’s actually growing? There is certainly a lot of discussion about it in the media and in policy circles. But there is actually very little hard data on the phenomenon, and no consistent statistics. Conventional labour market statistics either miss it altogether or fail to distinguish it from conventional freelancing.
The Online Labour Index (OLI) is the first economic indicator that provides an online gig economy equivalent of conventional labour market statistics. It measures the utilization of online labour across countries and occupations by tracking the number of projects and tasks posted on platforms in real time. It is available online as an interactive visualization and automatically updating data set. In this post, we will use the index to examine some very basic questions about the online gig economy: Is it growing? In which countries and occupations is it growing?
Where is the online gig economy growing?
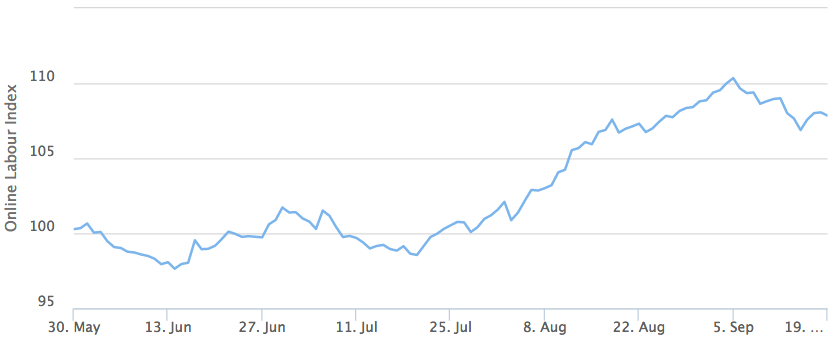
The graph above plots the Online Labour Index from May to September 2016. We can see in the graph that the index grew by about 9 points (9%) from May to mid-September 2016. This represents an annual growth rate of 25%, which is an extremely rapid growth rate for a labour market. It will be interesting to see whether some kind of a leveling off happens in the index during the rest of the year. In June and early July the index dipped a little, perhaps because many employers and workers took a summer break.
The graph above shows the total index, but where is this growth happening? To examine this, we can break down the index by employer’s country. Because of limitations in our early data, our visualization tool can draw the country breakdown from August onwards only, and not much change is visible yet in the one-month period since then. However, the underlying data allow us to calculate country growth rates since May. They show that growth from May to September was fastest among UK employers, who increased the volume of labour bought online by nearly 14%. Over the same period, there was a 7.5% rise elsewhere in Europe and 6% in the US. These are striking figures when they are contrasted with growth rates in conventional labour markets, which remained stagnant in the UK and US according to latest national statistics.
Which occupations are growing in the online gig economy?
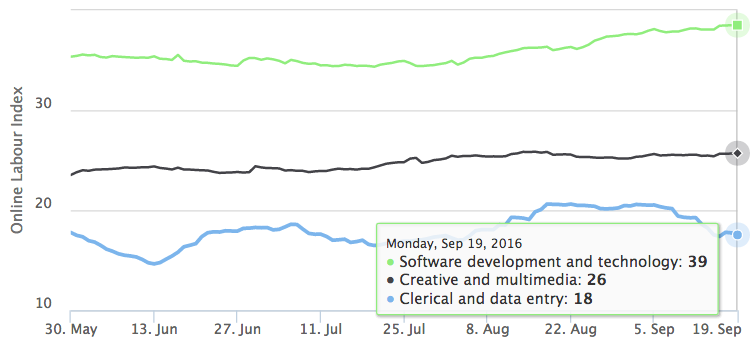
In what kinds of occupations is the online gig economy growing? To put it differently, what kinds of skills are in demand online? The graph above plots the Online Labour Index by occupation, focusing on the top three occupations. It shows that the Software development and technology category grew approximately 14% from May to September, while Creative and multimedia grew approximately 8% over the same period. The Clerical and data entry category fluctuated up and down, with no net change in size from May to September. Other occupations not shown in the graph (writing, sales, and professional services) grew slightly. Overall, it looks like the online gig economy’s growth over this period was driven more by skilled occupations than routine work.
Use the Online Labour Index to produce your own analyses
Do you have questions about the online gig economy’s growth that this post didn’t address? All the figures in this post were produced with OLI’s interactive visualization tool, which you can use to explore the data further. You can also download the data to produce more detailed analyses.

