Our new Online Labour Index worker map provides a real-time measurement of the online gig economy by revealing where different types of jobs are taking place. To our knowledge, we are the first ones to provide this measure from across multiple platforms.
The main strength of our our approach is the fact that it is updated in real time. In this sense, it complements snapshot studies such as Kuek’s and others’ 2015 study and Horton, Kerr and Stanton 2017. Methodologically, our results might not entirely comparable to the previous estimates since they use slightly different definitions, data sources and measures.
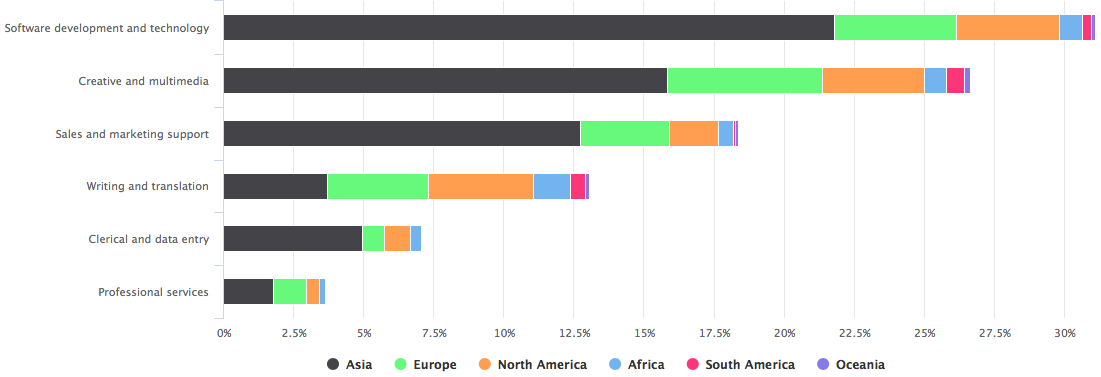
Comparison of the OLI worker and OLI employer statistics to one another reveals a couple of clear similarities as well as striking differences. On both sides of the market, software development is by far the dominant occupation, followed by creative and multimedia. On labour demand side, remaining occupations are, in the order of prevalence: clerical and data entry, writing and translation, sales and marketing support and professional services. On the labour supply side, sales and marketing support is trailing creative and multimedia followed by writing, clerical and data entry.
The occupation differences between the two OLI visualisations non-negligible in size, and are likely partly explained by slightly different data sources. Nonetheless, another likely explanation for the discrepancy are the styles of transaction. It is likely that a larger share of sales and marketing support and writing vacancies are “hidden” in the sense that they are filled by direct contact to workers instead of posting an opening.