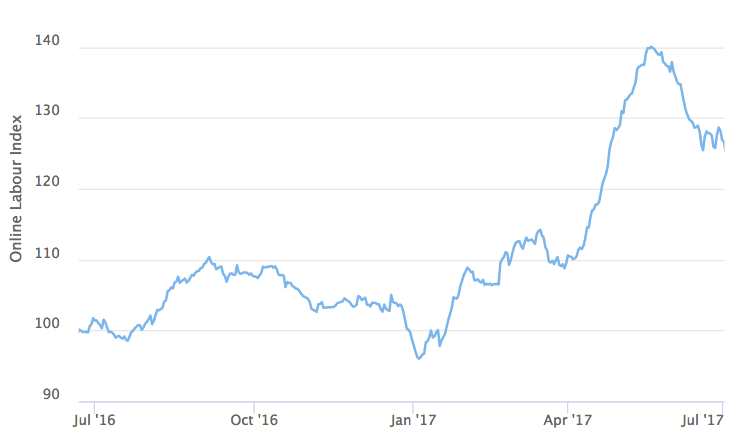
Online Labour Index, July 2016 – June 2017 (28-day moving average)
Online freelancing and crowdwork are some of the terms used for temporary and project-based work conducted remotely over digital platforms. Unlike the local gig economy of driving and delivery work, this online gig economy often requires specialized skills such as programming and graphic design. Conventional economic indicators are poor at measuring this new market, so we’ve built the award-winning Online Labour Index to track its development.
When I last wrote about growth in the online gig economy, we had been tracking the market for just five months. I noted that during those five months the market had grown 9 percent, which implies an annual growth rate of 25 percent. This is a strikingly high growth rate, especially when contrasted with national labour markets, which remained essentially stagnant.
But the 9 percent bump could very well have just been seasonal variation. After all, having a flexible workforce during demand peaks is one motivation why firms use online freelancers. The initial growth might well have been offset by a corresponding retreat by the end of the 12-month cycle.
Turns out it was not just seasonal variation. Now that we have gathered a full year’s worth of data and more, we can see that the market grew by 25.5 percent from 1 July 2016 to 30 June 2017! This means that over a quarter more tasks and projects were posted in a day than just a year before. A little under half of this growth was due to a dramatic spurt in the last three months of the period.
Where is the growth coming from?
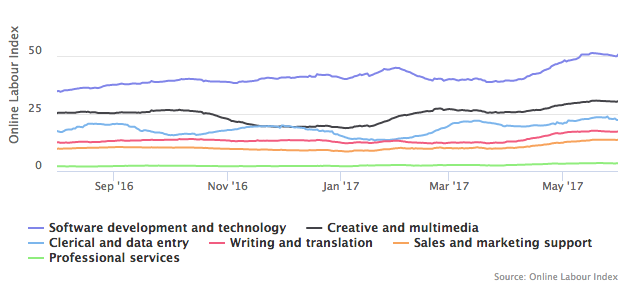
Online Labour Index by occupation, 1 Aug 2016 – 30 May 2017 (28-day moving average)
Breaking down the index by occupation provides some interesting insights. Software development and technology work is the biggest occupation category in the market, and also among those that grew the fastest. It rose from 35.0 index points on 1 July 2016 to 48.8 points on 30 June 2017, which is an increase of 37 percent. The next biggest category — Creative and multimedia — grew 21 percent. The third largest category, Clerical and data entry, did not grow at all in net terms. This category consists largely of the kind of work done on Amazon Mechanical Turk.
The fastest-growing category of all was the smallest one, which is Professional services. It consists of services like accounting, business consulting, and legal advice. Projects in this category grew as much as 43 percent over the year, but they still represent less than three percent of the overall online gig economy.
The figures that I am quoting here refer to growth in the number of projects posted to online labour platforms. We currently track all projects posted publicly to six of the largest English-language platforms. We also track the traffic share of these platforms in relation to the overall market to ensure changes in market share don’t confound the index. More details on the methodology are available here.
U.S. employers dominate, Europe leads growth
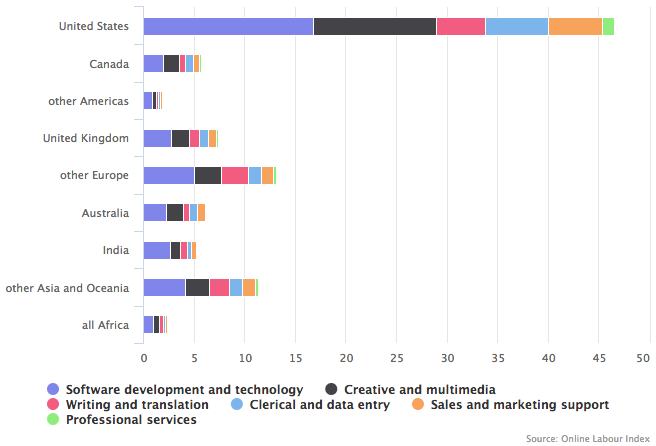
Online Laboux Index, employer country market share, 30 May 2017 (top 5 countries, rest aggregated by region)
If we break down the index by employer/client country, we can see that growth was fastest in Europe (excluding UK) and slowest in India and Africa, which didn’t grow at all. United States has retained its position as the dominant employer country, having a market share of 46 percent. But last year its share was 52 percent, so employers elsewhere in the world are catching up.
A bumpy ride for workers
Overall the online gig economy grew significantly over the past year, but there were several large upswings and downturns within the year. The steep drop around Christmas and New Year no doubt reflects a seasonal pattern that we will see next year as well. The much bigger rally this spring followed by a retreat may be another seasonal effect, as buyers spend budgets awarded at the start of the accounting year; we’ll see if it repeats next year.
Different occupations also showed distinct patterns. The market for Clerical and data entry work fluctuated strongly on an approximately two-month cycle, whereas the otherwise fairly constant Creative and multimedia category suffered a depression from November to January that temporarily cut the amount of work by a fifth.
Overall the market seems to be growing rapidly, though, and with the Online Labour Index interactive visualisation you can keep track of it in almost real time. The underlying data is also available for reuse. Comments and queries are most welcome; the easiest way to reach us is via Twitter.